This report establishes consistent monitoring on the performance of the building consent system, with a particular focus on building consent and code compliance certificate timeframes.
The data shown here is as reported by Building Consent Authorities (BCAs).
Timeframes for building consent or code compliance certificate approval, or both, are some of the key indicators for building consent system performance. Delays in the system can have flow-on effects for builders and homeowners and limit the capacity of the industry to work as efficiently and quickly as possible.
By establishing regular performance monitoring, we aim to identify and address these delays promptly, thereby enhancing our operational and system efficiency.
The overall timeframe results include all application data (ie building consent applications, amendments, and code compliance certificates).
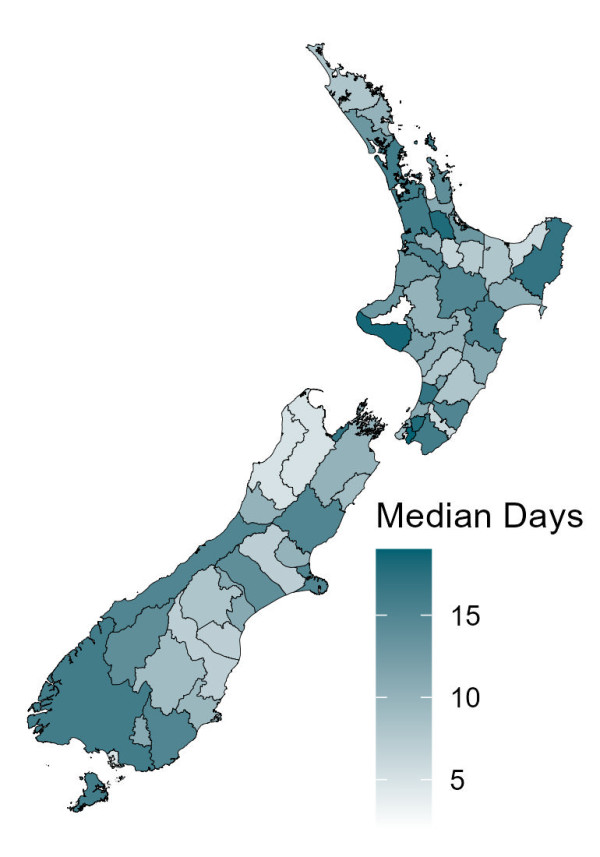
Data for the second quarter of 2024 shows the overall median time to process an application was 9 working days. All BCAs had a median processing time of less than 20 days (see figure 1 below).
In total, 91.4% of applications were processed within the statutory period (see figure 2 below). Of the 69 BCAs, 7 processed 100% of their applications within the statutory timeframe.
Figure 1. Median number of days for processing all applications

Text description for figure 1
During the second quarter of 2024, a total of 20,864 applications for Building Consents (including amendments), and 18,534 applications for Code Compliance Certificates (CCCs), were processed.
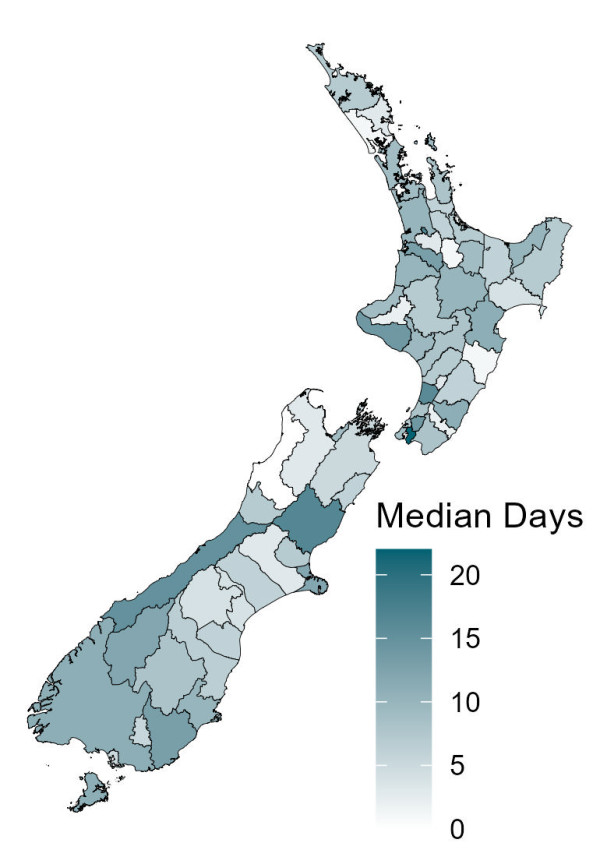
Out of all the Building Consent applications, 89.2% were processed within the statutory timeframe. The median processing time for these applications was 13.0 working days.
On the other hand, the median processing time for Code Compliance Certificates were much shorter at 5 working days. Nearly all (93.9%) of CCCs were processed within the statutory timeframe.
Almost all (66 out of 67) BCAs (excluding the regional authorities due to the low number of applications) had a median processing time for Building Consents at or below 20 working days, and all 67 BCAs had a median processing time for Code Compliance Certificates below the statutory timeframe.
Figure 2. Median days for processing Building Consent applications, excluding regional authorities and Consentium

Text description for figure 2
| BCA | Median processing days |
|---|---|
| Ashburton | 12.0 |
| Auckland | 16.0 |
| Buller | 7.0 |
| Carterton | 6.0 |
| Central Hawke's Bay | 11.0 |
| Central Otago | 8.0 |
| Christchurch City | 15.0 |
| Clutha | 10.5 |
| Dunedin City | 12.0 |
| Far North | 9.0 |
| Gisborne | 9.0 |
| Gore | 8.0 |
| Grey | 7.0 |
| Hamilton City | 18.0 |
| Hastings | 9.0 |
| Hauraki | 11.0 |
| Horowhenua | 19.0 |
| Hurunui | 13.0 |
| Hutt City | 16.5 |
| Invercargill City | 5.0 |
| Kaikōura | 9.0 |
| Kaipara | 11.0 |
| Kawerau | 9.0 |
| Kāpiti Coast | 9.0 |
| Mackenzie | 8.0 |
| Manawatu | 7.0 |
| Marlborough | 12.0 |
| Masterton | 15.0 |
| Matamata-Piako | 19.0 |
| Napier City | 21.0 |
| Nelson City | 15.0 |
| New Plymouth | 11.0 |
| Palmerston North City | 11.0 |
| Porirua City | 11.0 |
| Queenstown Lakes | 13.0 |
| Rangitikei | 6.0 |
| Rotorua Lakes | 11.0 |
| Ruapehu | 6.0 |
| Selwyn | 17.0 |
| South Taranaki | 11.0 |
| South Waikato | 9.0 |
| South Wairarapa | 13.0 |
| Southland | 14.0 |
| Stratford | 3.0 |
| Tararua | 13.0 |
| Tasman | 9.0 |
| Taupō | 9.0 |
| Tauranga City | 15.0 |
| Thames-Coromandel | 13.0 |
| Timaru | 14.0 |
| Upper Hutt City | 19.0 |
| Waikato | 19.0 |
| Waimakariri | 8.0 |
| Waimate | 7.0 |
| Waipa | 12.0 |
| Wairoa | 19.0 |
| Waitaki | 10.0 |
| Waitomo | 10.0 |
| Wellington City | 10.1 |
| Western Bay of Plenty | 13.0 |
| Westland | 20.0 |
| Whakatāne | 6.0 |
| Whanganui | 10.0 |
| Whangārei | 13.0 |
| Ōpōtiki | 11.0 |
| Ōtorohanga | 12.0 |
The median time to process all applications (building consent applications, amendments, and code compliance certificates) was 8 days for residential buildings, and 15 days for commercial buildings.
93.2% of residential applications and 79.6% of commercial applications were processed within the statutory timeframe.
Note that most of the applications processed (85.8%) were for residential buildings.
Figure 3. Median days for processing applications for residential buildings, excluding regional authorities and Consentium

Text description for figure 3
| BCA | Median processing days |
|---|---|
| Ashburton | 6.0 |
| Auckland | 9.0 |
| Buller | 6.0 |
| Carterton | 3.0 |
| Central Hawke's Bay | 2.0 |
| Central Otago | 9.0 |
| Christchurch City | 11.0 |
| Clutha | 6.0 |
| Dunedin City | 12.0 |
| Far North | 7.0 |
| Gisborne | 3.0 |
| Gore | 5.0 |
| Grey | 5.0 |
| Hamilton City | 18.0 |
| Hastings | 7.0 |
| Hauraki | 9.0 |
| Horowhenua | 19.0 |
| Hurunui | 14.0 |
| Hutt City | 12.0 |
| Invercargill City | 5.0 |
| Kaikōura | 5.0 |
| Kaipara | 3.0 |
| Kawerau | 3.0 |
| Kāpiti Coast | 7.0 |
| Mackenzie | 2.5 |
| Manawatu | 5.0 |
| Marlborough | 9.0 |
| Masterton | 11.0 |
| Matamata-Piako | 12.0 |
| Napier City | 7.0 |
| Nelson City | 11.0 |
| New Plymouth | 10.0 |
| Palmerston North City | 5.0 |
| Porirua City | 8.0 |
| Queenstown Lakes | 11.0 |
| Rangitikei | 5.0 |
| Rotorua Lakes | 8.0 |
| Ruapehu | 4.0 |
| Selwyn | 6.0 |
| South Taranaki | 7.0 |
| South Waikato | 4.0 |
| South Wairarapa | 12.0 |
| Southland | 13.0 |
| Stratford | 3.0 |
| Tararua | 8.0 |
| Tasman | 4.0 |
| Taupō | 8.0 |
| Tauranga City | 9.0 |
| Thames-Coromandel | 6.0 |
| Timaru | 4.0 |
| Upper Hutt City | 16.0 |
| Waikato | 10.0 |
| Waimakariri | 6.0 |
| Waimate | 6.0 |
| Waipa | 6.0 |
| Wairoa | 8.0 |
| Waitaki | 10.0 |
| Waitomo | 4.0 |
| Wellington City | 9.8 |
| Western Bay of Plenty | 8.0 |
| Westland | 16.0 |
| Whakatāne | 4.0 |
| Whanganui | 8.0 |
| Whangārei | 9.0 |
| Ōpōtiki | 10.0 |
| Ōtorohanga | 3.0 |
Download the pdf A3 version: